Analytics on youtube: Master Your Channel with Data-Driven Insights
YouTube analytics is really just the process of using the platform’s own data tools to figure out how your videos are performing and what your audience is up to. Don't think of it as a boring spreadsheet full of numbers. Instead, see it as a direct line of feedback from your viewers, showing you exactly what they love and what makes them click away.
Your Guide to the YouTube Analytics Dashboard
Welcome to your channel's command centre. For a lot of creators, the whole idea of diving into analytics can feel a bit daunting—like you're about to step into a room full of confusing charts and technical jargon. But honestly, it's much simpler than that. Your analytics dashboard is more like a storybook, where every metric is a chapter about your audience. It's hands-down the most powerful tool you have for turning a creative passion into a channel that genuinely thrives.
Instead of just guessing what your viewers want, analytics gives you solid answers. It tells you which videos are hitting the mark, where your audience is finding you, and even the best times to catch them online. This isn't about trying to outsmart an algorithm; it's about getting to know the people on the other side of the screen.
Navigating to Your Channel's Command Centre
Finding this treasure trove of information is pretty straightforward. You can get to your YouTube Analytics right from the YouTube Studio, which is the backend hub for every creator.
- Log in to YouTube: Just head to your channel's homepage.
- Access YouTube Studio: Click your profile picture in the top-right corner and choose "YouTube Studio" from the menu that pops up.
- Find Analytics: Look for the "Analytics" tab on the left-hand navigation menu and click on it.
Once you’re in, you’ll land on a dashboard with a few key tabs, usually starting with an Overview. This main page gives you a quick, bird's-eye view of your channel's health, showing you the vital signs like views, watch time, and subscriber changes over a set period. Think of it as your first stop for a quick performance check-up.
"The moment I stopped seeing analytics as 'scary numbers' and started seeing them as 'viewer feedback' was the moment my channel began to grow. The data doesn't judge; it just tells you what's working."
A Glimpse into Key Dashboard Sections
Beyond the Overview, you'll spot other important tabs like Reach, Engagement, and Audience. Each one tells a different part of your channel’s story. For instance, the Reach tab shows you how many people are seeing your thumbnails (impressions) and how many are actually clicking on them (click-through rate). Getting a handle on these basic areas is the first step toward making informed decisions instead of just creating content in the dark.
Take creator Ali Abdaal, for example. He often talks about using his analytics to see which topics get the highest engagement. He noticed that his videos on productivity tools and study techniques consistently had a higher average view duration. This data told him to double down on that content pillar, creating more videos about apps like Notion and effective learning strategies. He knew it was something his audience valued, and listening to this data led to explosive channel growth. That's the power of listening to your data.
To really get the hang of it, you might want to explore some general analytics principles to get a broader perspective that pairs well with YouTube-specific insights. You can also explore how to connect your channels and start your own analytics journey.
Decoding the Metrics That Actually Matter
When you first open your YouTube Analytics dashboard, it's easy to feel a bit overwhelmed by all the numbers. But here’s the secret: you don't need to track everything. The real story of your channel's health and your video's performance is told by just a handful of core metrics.
Think of these numbers less as dry statistics and more as direct feedback from your audience. Learning to read them is like learning a new language—the language of the YouTube algorithm. Once you're fluent, you can stop guessing what people want and start creating content you know will connect.
This flow chart gives you a good sense of how to approach your analytics, starting with the big picture and then drilling down into the specifics of how you find and hold an audience.
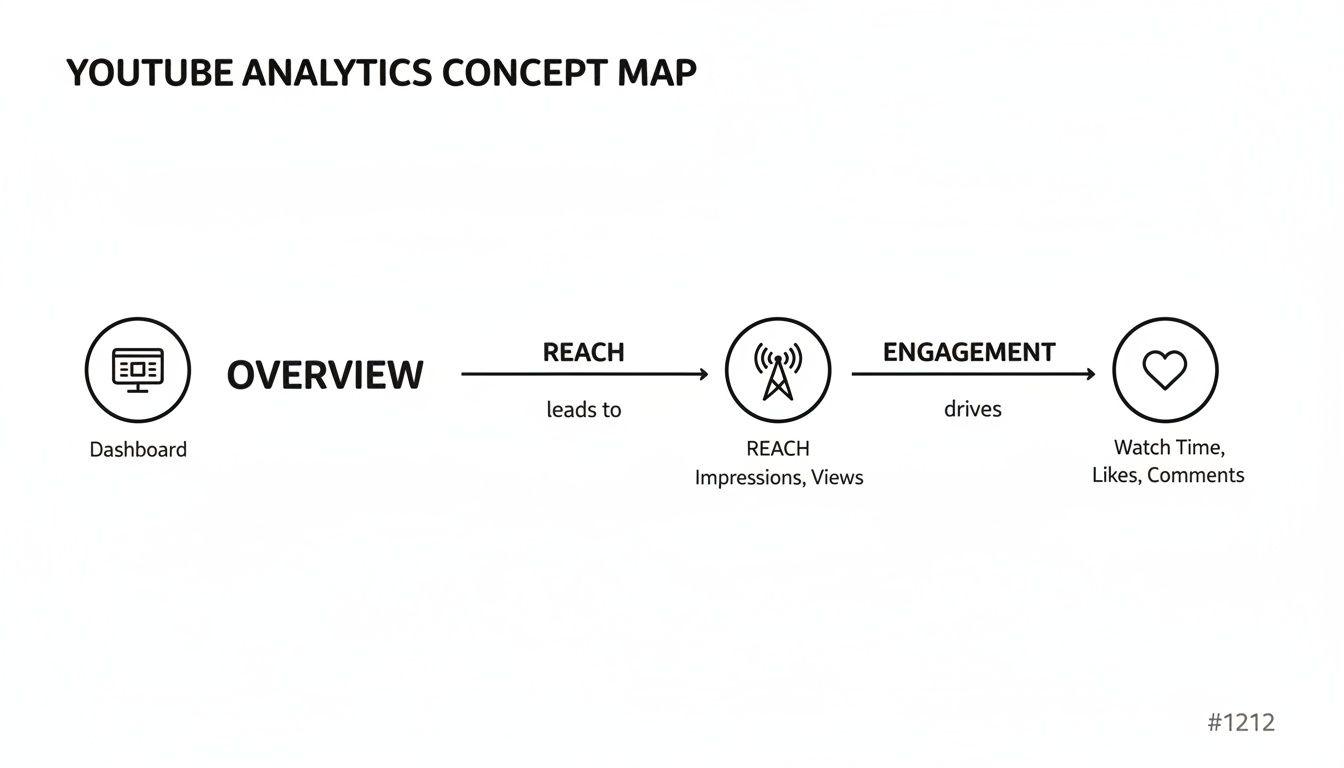
It all begins with a general overview, which then splits into two key areas: Reach (how many people see your content) and Engagement (what they do once they see it). Let’s break that down.
The First Hurdle: From Impressions to Views
Before a single person can watch your video, they have to see it first. That's where Impressions and Click-Through Rate (CTR) come in.
- Impressions: This is simply how many times YouTube showed your video's thumbnail to someone. A high number of impressions means the algorithm is actively testing your content with potential viewers.
- Click-Through Rate (CTR): This is the percentage of people who saw your thumbnail and actually clicked to watch. A strong CTR tells you that your title and thumbnail are doing their job—they're sparking curiosity and grabbing attention.
Your title and thumbnail work together like a movie poster. An impression is someone walking past that poster. The CTR is the percentage of people who stop, look, and decide to buy a ticket. If you're getting lots of impressions but not many views, it's a clear signal that your "poster" isn't compelling enough to earn the click.
Why Watch Time Is the Real Currency
Views used to be the star of the show, but for a long time now, Watch Time has been the metric that truly moves the needle. This is the total, cumulative time people have spent watching your videos, and it's one of the strongest signals of quality you can send to YouTube.
Why is it so important? Simple. YouTube’s business model is built on keeping people on the platform for as long as possible. A video with a high total watch time tells the algorithm that your content is satisfying and valuable, which makes it far more likely to get recommended to a wider audience.
A video with 10,000 views where people watch for one minute is less valuable to the algorithm than a video with 5,000 views where people watch for five minutes. The second video has a much higher total watch time, signalling it’s a better piece of content.
Reading the Story of Engagement
Once someone clicks, two other metrics paint a vivid picture of how well your video held their attention: Average View Duration (AVD) and Audience Retention.
Average View Duration is exactly what it sounds like: the average amount of time a viewer stuck around. A higher AVD is always a good thing because it directly boosts your total watch time.
The Audience Retention graph, however, is where the real gold is hidden. This chart shows you, second by second, the percentage of viewers who are still watching. It’s your secret weapon for finding out what's working and, more importantly, what isn't.
- Sudden Dips: These are red flags. They often mark a spot where viewers got bored, confused, or felt the video wasn't delivering on the promise of its title.
- Spikes or Bumps: These are brilliant! They show you which parts of your video people are re-watching, which points to highly valuable or entertaining moments.
Take MrBeast, for example. He and his team are famous for obsessively studying their retention graphs. They learned that long, drawn-out intros with branding or pleas to subscribe caused huge numbers of people to click away. This is why his videos now get straight to the action in the first few seconds. This data-first approach to hooking the viewer is a massive part of his success.
To make sense of it all, here's a quick reference table.
Key YouTube Metrics and What They Really Mean
This table breaks down the essential metrics you'll find in your analytics dashboard, explaining what each one measures and why it should be a part of your channel strategy.
| Metric | What It Measures | Why It Is Important |
|---|---|---|
| Impressions | The number of times your video's thumbnail was shown to users on YouTube. | Indicates how widely YouTube is testing your content. High impressions are an opportunity to get more views. |
| Click-Through Rate (CTR) | The percentage of impressions that resulted in a click to watch your video. | Measures the effectiveness of your title and thumbnail. A high CTR means your packaging is compelling. |
| Views | The number of times your video has been played. | A basic measure of reach, but it needs context from other metrics to be truly meaningful. |
| Watch Time | The total accumulated time viewers have spent watching your video. | A critical ranking signal. Tells YouTube your content is engaging and keeps people on the platform. |
| Average View Duration (AVD) | The average length of a single viewing session for your video. | Directly impacts Watch Time. A higher AVD suggests your video is holding attention well. |
| Audience Retention | A second-by-second graph showing the percentage of viewers who are still watching. | The ultimate diagnostic tool. Helps you pinpoint boring parts (dips) and engaging moments (spikes). |
By keeping an eye on these key figures, you can get a really clear picture of how your audience interacts with your work, helping you make smarter decisions for your next video.
Understanding these metrics isn't just a technical exercise; it's a core part of the creative process. In the UK, professional marketers are deeply invested in analytics, with 66% tracking engagement metrics and 62% monitoring views to assess content performance. This shows how the pros use data to inform their entire strategy. You can discover more about these video marketing statistics and see how they're shaping the industry.
Understanding Your Audience and Traffic Sources
Beyond just tracking video performance, the real magic of YouTube analytics lies in figuring out who is watching your content and how they stumbled upon it. This is where you move past the cold, hard numbers and start to understand the people behind the screen. Jumping into your 'Audience' and 'Reach' tabs is like creating a detailed profile of your ideal viewer.
This knowledge is your secret weapon. When you know your audience’s age, where they live, and what they’re into, you can start tailoring your content to what they genuinely love. It's the difference between shouting into an empty room and having a real conversation with a community that actually wants to hear from you.

Who Is Watching Your Content?
Think of the 'Audience' tab in YouTube Analytics as your virtual meet-and-greet. It lays out all the key demographic data, giving you a brilliant snapshot of the community you’ve managed to build.
Here are the key insights you'll find:
- Age and Gender: Are you talking to Gen Z students or seasoned professionals? Knowing this is crucial for hitting the right tone and making relevant references.
- Geography: Find out which countries and cities your viewers call home. You might discover an unexpected pocket of fans in a place you never considered.
- Watch time from subscribers: This is a big one. It tells you how much of your watch time comes from your loyal, subscribed fans versus casual passers-by.
In the UK, YouTube is an absolute powerhouse. Audiences spend an average of 44 minutes daily on the platform, and while it's especially popular with Gen Z (90% of them are on it), it’s still a go-to for older demographics. The gender split is also nicely balanced at roughly 50/50. These numbers just go to show the huge potential for creators in almost any niche. You can discover more insights about UK YouTube usage on Statista.com.
How Are Viewers Finding You?
Just as vital as who is watching is how they're finding you in the first place. For this, you’ll want to head over to the 'Traffic Sources' report, which you'll find under the 'Reach' tab. This data tells the story of how your videos are being discovered across the vast YouTube ecosystem.
Understanding these sources is critical because each one calls for a different strategy. A viewer who finds you through search has a completely different mindset than someone who spots your video on their homepage.
Don’t just look at which traffic source is the biggest. Instead, analyse which one brings you the most engaged viewers. A source that sends fewer views but with a much higher average view duration is often where your most valuable audience is hiding.
Let’s break down the most common traffic sources and what they really mean.
Major YouTube Traffic Sources
- Browse Features: This is traffic from the YouTube homepage, the subscription feed, and other browsing pages. If you're doing well here, it means your titles and thumbnails are grabbing attention and the algorithm likes what you're doing.
- YouTube Search: These viewers are on a mission. They're actively looking for an answer or a specific type of video. This is incredibly valuable traffic, and you can boost it by optimising your titles and descriptions with the right keywords.
- Suggested Videos: This is when your video pops up next to or after another one. Getting views from here is a fantastic sign, as it means YouTube sees your content as the logical next watch for viewers.
- External: This covers all the traffic coming from outside YouTube, like from websites and apps that embed your videos or link to them. Think social media shares, blog posts, and forums.
A Practical Case Study in Action
Let’s look at a case study from the travel channel, The Timeliners. They noticed a significant portion of their audience was from outside India, particularly from countries with large Indian diaspora populations. Digging into their analytics on YouTube, they saw comments asking for subtitles.
Here we have a classic analytics puzzle. The interest was clearly there (that’s the view count from different geographies), but the engagement could be deeper. What's the most likely reason? A language or dialect barrier.
Armed with this insight, they started adding English subtitles to all their videos. A few weeks later, they checked their analytics again. The results were undeniable—the average watch time from viewers in the US, UK, and Canada shot up by over 30%. They turned a casual audience into a properly engaged global community, all by listening to the story their data was trying to tell them.
Turning Analytics Into Winning Video Ideas
Your YouTube Analytics dashboard is far more than just a report card on past videos. Think of it as a treasure map. If you know how to read it, it’ll lead you straight to your next hit video, helping you stop guessing what to create and start making content you know people are looking for.
This isn't about ditching your creativity; it's about fuelling it with real data. When you let your audience's behaviour guide your content strategy, you move with confidence, knowing each idea is built on a solid foundation, not just a gut feeling.
Mine Your Traffic Sources for Proven Topics
One of the most valuable, and often overlooked, spots for brilliant ideas is the ‘YouTube Search’ traffic source report. This is where you see the exact phrases people are typing into YouTube right before they find one of your videos. These aren't just keywords; they're direct requests from your audience.
Let's say you have a cooking channel. You're digging through your search terms and notice that "quick weeknight pasta recipe" is driving a surprising amount of traffic to a video where you only mentioned it in passing. That's a massive clue. Your viewers don't just want pasta—they specifically need fast, easy meals for their busy lives.
That one little insight can spark a whole new direction:
- Create a Pillar Video: Your very next video could be "The Only 5 Weeknight Pasta Recipes You'll Ever Need," directly answering that searcher's need.
- Build a Content Series: You could follow that up with related videos like "15-Minute Meal Prep for Busy People" or "One-Pan Dinners That Actually Taste Good."
- Optimise Older Content: It’s also a great idea to go back to older videos and sprinkle these proven keywords into titles, descriptions, and tags where relevant.
Following this path creates a powerful feedback loop. You use real search data to make a video, that video then starts ranking for those terms, and you get even more viewers and more data to fuel your next big idea. A deep dive into your YouTube analytics dashboard can reveal the patterns and viewer behaviours essential for learning how to make a video go viral on YouTube.
Decode Retention Graphs to Find Hidden Gems
Your audience retention graphs don't just tell you when people click away; they also show you the exact moments that had them glued to the screen. Be on the lookout for spikes and plateaus—these are the parts your viewers are re-watching, which signals intense interest or high value.
"A dip in your retention graph tells you what to fix. A spike in your retention graph tells you what your next video should be about."
These little peaks are where the seeds for entire video series are hiding. Learning to analyse these high-engagement moments is a core part of using analytics on YouTube to give your audience more of what they truly love.
Case Study: The Gaming Channel That Found Its Niche
Let’s look at how this works in the real world. A small gaming channel was focused on long, detailed playthroughs of a popular strategy game. The creator started noticing a funny pattern in their analytics. On every single video, the retention graph had sharp little spikes right when they were explaining a complex tactical move.
People weren't just watching; they were rewinding and re-watching those specific moments to really master the technique. The creator had a lightbulb moment: maybe the audience wasn't there for the whole hour-long playthrough, but for these concentrated nuggets of expertise.
Acting on this insight, the creator launched a new series called "Tactical Tuesdays." Each video was short—under five minutes—and zeroed in on breaking down a single, complex in-game strategy. The results were immediate and explosive.
- Higher Average View Duration: The short, focused format meant people were watching a much higher percentage of each video.
- Increased Engagement: The comments section blew up with viewers asking for specific tactics to be covered in future episodes.
- Subscriber Growth: The channel quickly became the go-to resource for high-level strategy, attracting a super-dedicated audience.
This channel completely changed its trajectory by paying attention to just one key metric. They stopped making the content they thought people wanted and started making what the data proved they craved. Learning how to spot these patterns is key, and you can learn more about finding the right angle by exploring different trend and angle finding techniques. By turning analytics into action, they built a thriving community simply by providing targeted value.
Optimising Thumbnails, Titles, and Timing
A video's fate is often sealed long before anyone clicks play. Your thumbnail and title are your first, and sometimes only, chance to make a good impression—they're the digital equivalent of a book cover, making a promise and sparking curiosity. Thankfully, your analytics dashboard is the perfect place to figure out what works.
Think of your Click-Through Rate (CTR) as your own personal A/B testing lab. It gives you direct, unfiltered feedback on how well your video’s packaging is doing its job. When you first publish, YouTube shows your video to a small group of people. If your CTR is high, it tells the algorithm that your thumbnail and title are compelling, and it’ll start pushing your video to a wider audience. A low CTR, on the other hand, signals the opposite.
Using CTR to Test Your Thumbnails and Titles
This doesn't have to be a complicated process. If you notice a video’s CTR is lagging behind your channel average after the first 24-48 hours, that's a crystal-clear sign that your thumbnail or title just isn't hitting the mark. This is your cue to start experimenting.
Here’s a simple workflow to follow:
- Spot the Underperformers: Hunt for videos that have plenty of impressions but a low CTR (say, below 3-4% when your channel average is 6%).
- Make an Educated Guess: Why isn't it working? Is the text on the thumbnail too small to read on a phone? Is the emotion on your face unclear? Is the title just a bit too vague?
- Change Just One Thing: Tweak either the thumbnail or the title—but never both at the same time. This is key, as it lets you isolate exactly what made the difference.
- Watch the Results: Check back in a day. Has the CTR improved? If it has, you've just found a winning formula you can use for future videos.
Paddy Galloway, a YouTube strategist, often shares case studies of this in action. For one client, a video about a celebrity interview was underperforming with a 2.5% CTR. The original thumbnail was a simple picture of the celebrity. They changed it to a split-screen thumbnail showing both the host and the celebrity with a shocked expression, adding a text overlay with a provocative quote from the interview. Almost overnight, the CTR jumped to 6%, and the video's views skyrocketed. This is a common story for creators who actively use their analytics on YouTube to fine-tune their work.
Finding Your Perfect Publishing Time
The other crucial piece of this puzzle is timing. Publishing your video right when most of your audience is online gives it the best possible start. You’re aiming for that initial burst of views and engagement that tells the algorithm you might have a hit on your hands.
Luckily, YouTube takes the guesswork out of this. Head over to the 'Audience' tab in your analytics, and you'll find the ‘When your viewers are on YouTube’ report. It’s a personalised heat map showing you the exact days and hours your audience is most frequently on the platform.

The darkest purple bars show you when the highest number of your viewers are active, giving you a clear window to schedule your uploads.
The "best time to post" isn't some universal secret you find in a generic article. It’s a unique, personalised answer waiting for you inside your own analytics dashboard.
By scheduling your video to go live an hour or two before these peak times, you give YouTube enough time to index it, ensuring it’s ready and waiting for your community the moment they log on. For a deeper dive into this strategy, take a look at our guide on the best times to post on YouTube. When you combine a compelling thumbnail, a curiosity-driven title, and perfect timing, you've got a seriously powerful combination.
Your Top YouTube Analytics Questions, Answered
As you start digging into your channel's data, you'll find that some questions pop up again and again. Let's tackle a few of the most common ones that creators wrestle with, so you can stop wondering and start making smarter decisions.
How Long Until My YouTube Analytics Are Accurate?
This is a big one. You’ve just uploaded a video, and you’re hitting refresh, but the numbers aren’t moving. Don’t panic! While the Realtime data gives you a sneak peek within a couple of hours, it’s just an estimate.
For the full, verified picture—think finalised watch time, revenue, and audience demographics—you need to give it 48 to 72 hours. YouTube uses this time to clean up the data, filtering out bot traffic and making sure everything is legitimate. One of the biggest rookie mistakes is making snap judgements based on the first few hours. Sit back, be patient, and wait for the complete story before deciding if a video is a hit or a miss.
What's Considered a "Good" Click-Through Rate on YouTube?
There's no magic number here, as a "good" Click-Through Rate (CTR) depends heavily on your niche and where people are finding your video. That said, YouTube itself has mentioned that roughly half of all channels have a CTR between 2% and 10%.
But context is everything. A video that pops up on someone's homepage might need a really high CTR to keep getting pushed by the algorithm. On the other hand, a video found through a specific search term can perform well with a lower CTR because the viewer is already highly motivated.
Instead of aiming for a universal benchmark, focus on improving your own average. If your channel typically sits at a 4% CTR, your real goal should be to experiment with new thumbnail designs and title formulas to see if you can nudge that up to 5% and beyond.
Why Are My Impressions High but Views Are Low?
Ah, the classic creator conundrum. First off, high impressions are a good thing! It means the YouTube algorithm sees potential in your video and is actively showing it to people. You've won the first half of the battle.
The low view count, however, tells you the second half of the story: your packaging isn't closing the deal. Your thumbnail and title simply aren't compelling enough to make someone stop scrolling and actually click. This gap between potential eyeballs and actual views is measured by your Click-Through Rate (CTR).
To start bridging that gap, have an honest look at your video's packaging:
- Is the thumbnail clear and striking? Imagine it on a tiny mobile screen, surrounded by dozens of others. Does it pop?
- Does the title create curiosity or promise a solution? It needs to give someone a compelling reason to click, without feeling like clickbait.
- Do the title and thumbnail work as a team? They should tell a mini-story together, making the click feel irresistible.
Should I Delete Videos That Don't Perform Well?
It can be so tempting to get rid of underperforming videos, but in nearly every situation, the answer is a hard no.
Think of every video as a data point. A "flop" is really just a lesson in disguise, teaching you what your audience isn't interested in. That’s just as valuable as knowing what they love. If a new video format tanks, the awful retention graph is crystal-clear feedback not to pour more energy into that style.
Plus, you never know when a video might find its audience. A video that seems like a dud today could suddenly get picked up by YouTube Search months or even years down the line. Deleting it not only erases that possibility but also removes any watch time it has already contributed to your channel. Instead of hitting delete, analyse it. Use it as a case study to build a smarter, more resilient content strategy.
Ready to stop guessing and start creating content you know your audience wants? Vidito is your AI-powered co-pilot for YouTube ideation. We help you generate dozens of data-backed video ideas, validate them with real-time trend analysis, and organise your content calendar effortlessly. Turn insights into viral hits by visiting us at https://vidito.ai.